Debugging PHP code with VSCode and XDebug on a Docker Container
On the previous post we created an Apache/PHP Docker Container with the Xdebug extension.
Now we are going to use that container to demonstrate how to debug a PHP file using VSCode.
Dockerfile and PHP file
First let's create a folder for the Dockerfile and a sample PHP file. Change the current directory to this newly created folder.
mkdir ~/test_xdebug_docker

cd ~/test_xdebug_docker
With your preferred editor create two files "Dockerfile" and "index.php", and then copy into these files the following content:
Dockerfile
FROM centos:7

# Install Apache
RUN yum -y update
RUN yum -y install httpd httpd-tools

# Install EPEL Repo
RUN rpm -Uvh https://dl.fedoraproject.org/pub/epel/epel-release-latest-7.noarch.rpm \
 && rpm -Uvh http://rpms.remirepo.net/enterprise/remi-release-7.rpm

# Install PHP
RUN yum --enablerepo=remi-php73 -y install php php-bcmath php-cli php-common php-gd php-intl php-ldap php-mbstring \
    php-mysqlnd php-pear php-soap php-xml php-xmlrpc php-zip php-devel

# Update Apache Configuration
RUN sed -E -i -e '/<Directory "\/var\/www\/html">/,/<\/Directory>/s/AllowOverride None/AllowOverride All/' /etc/httpd/conf/httpd.conf
RUN sed -E -i -e 's/DirectoryIndex (.*)$/DirectoryIndex index.php \1/g' /etc/httpd/conf/httpd.conf

# Required for Xdebug compilation
RUN yum -y install make

# Install Xdebug
RUN pecl install xdebug

# Add Xdebug to PHP configuration
RUN echo "" >> /etc/php.ini \
 && echo "[xdebug]" >> /etc/php.ini \
 && echo "zend_extension = /usr/lib64/php/modules/xdebug.so" >> /etc/php.ini \
 && echo "xdebug.remote_enable = 1" >> /etc/php.ini \
 && echo "xdebug.remote_autostart = 1" >> /etc/php.ini \
 && echo "xdebug.remote_host = host.docker.internal" >> /etc/php.ini

EXPOSE 80

# Start Apache
CMD ["/usr/sbin/httpd","-D","FOREGROUND"]
index.php
<?php
header('Content-type: text/plain');

// Strings

$str = 'World';

$greeting = "Hello $str";

echo $greeting . "\n";


// For loop

for ($i = 1; $i < 5; $i++) {
    $number = 10 + $i;
    echo $number . "\n";
}


// Function

$list_of_numbers = [9, 5, 17, 12, 8, 2, 10];

function get_total($array) {
    $total = 0;
    foreach ($array as $item) {
        $total += $item;
    }

    return $total;
}

$total = get_total($list_of_numbers);
echo $total . "\n";
You can download the above files, as a zip file here.
You should have the following folder and files structure.
~/test_xdebug_docker/
   ├─ Dockerfile
   └─ index.php
Create the Docker Image and Container
Let's create the Docker Image, and the Container.
docker build -t image_apache .

docker run -tid -p 4000:80 --name=container_apache -v ~/test_xdebug_docker:/var/www/html image_apache
At this point our Container should be running and ready to receive requests at the port 4000.
VSCode and Xdebug
We can proceed now to open VSCode.
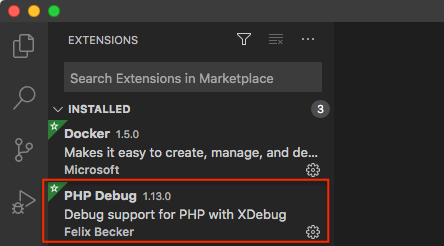
On VSCode make sure to have installed the PHP Debug extension.
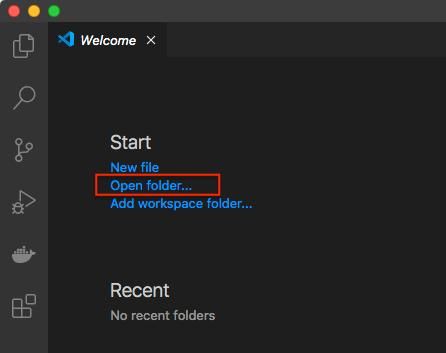
Next, click on Open folder... and locate the folder we just created above and select it.
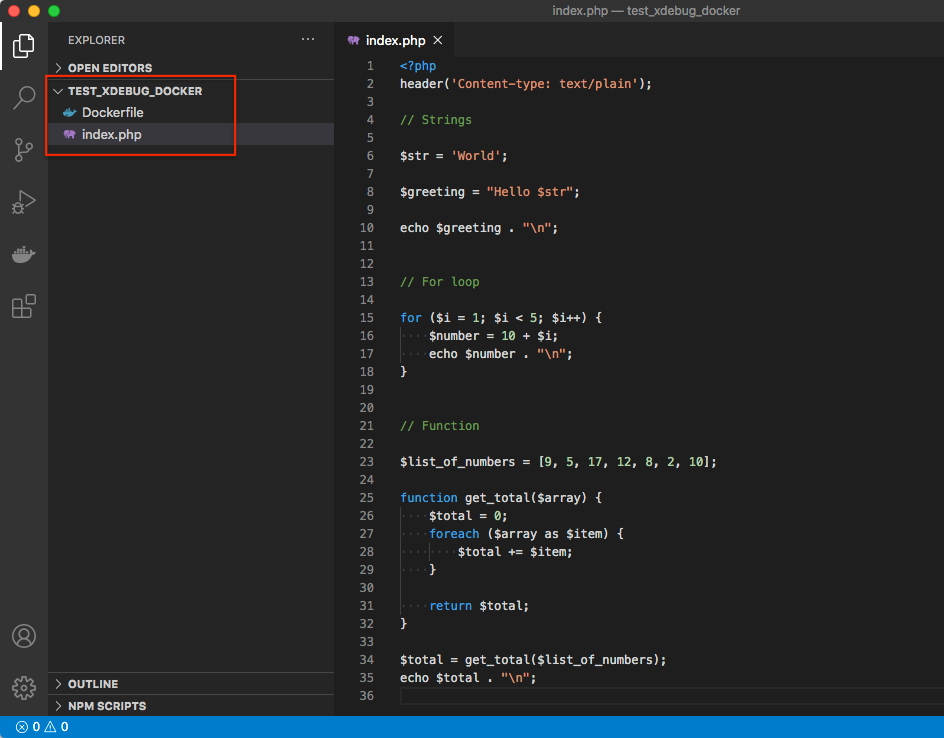
You should see the two files "Dockerfile" and "index.php"
Open the "index.php" file.
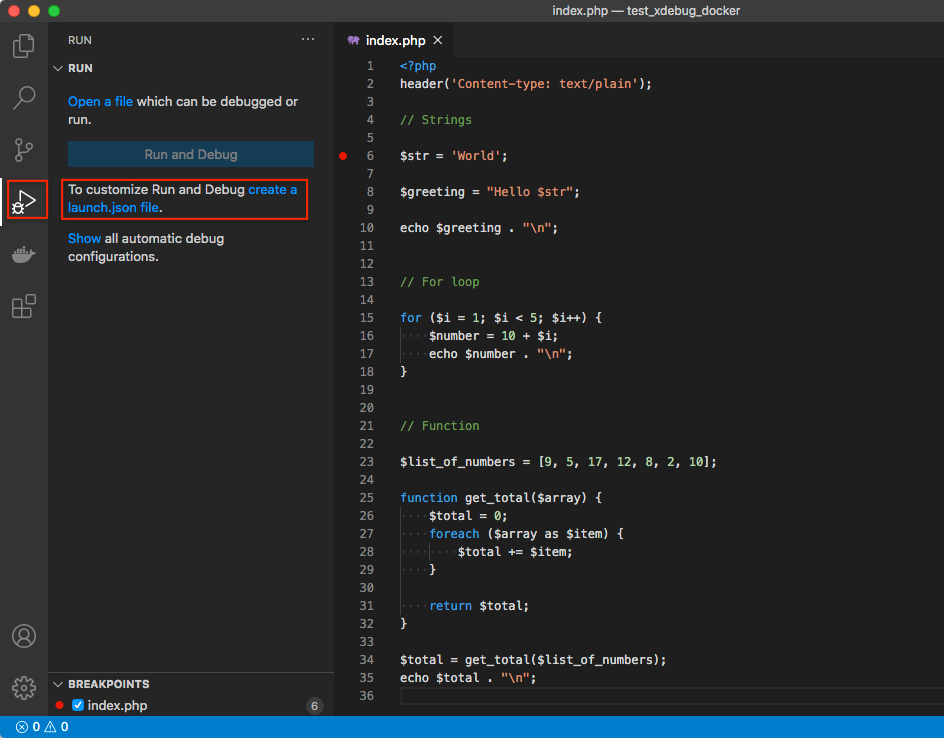
On the Line 6 of the index.php file, add a Breakpoint by clicking on the area at the left of the line numbers.
A "red" dot will appear indicating that the breakpoing has been set.
On the left navigation toolbar, click on the Run (Debugger) icon.
Then click on the create a launch.json file link.
A drop down will show up. Click on the PHP option.
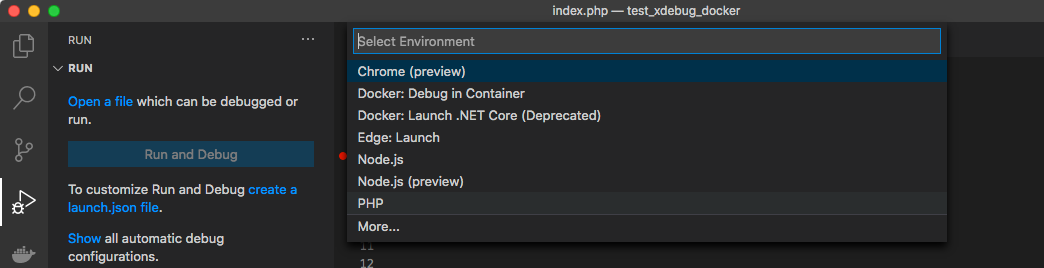
A new file named launch.json will be created on the main area, with the content shown on the screenshot below.
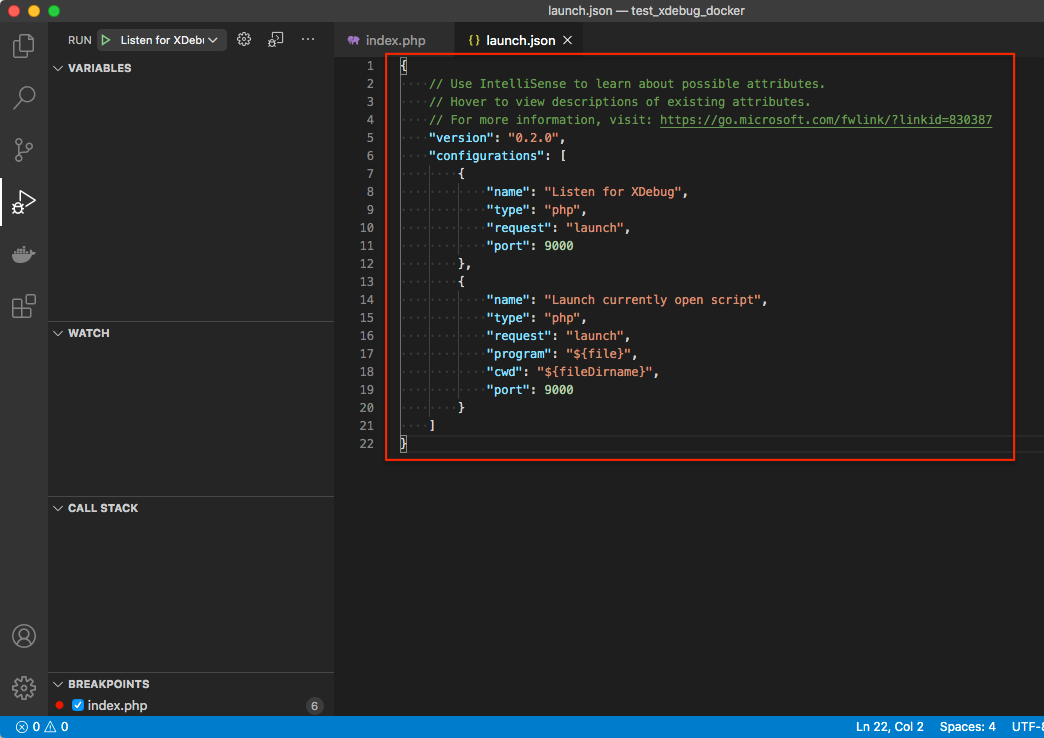
The launch.json contains two debugging configurations. We are going to use the one named "Listen for Debug"
But, before we start debugging, we need to add a new item to that configuration.
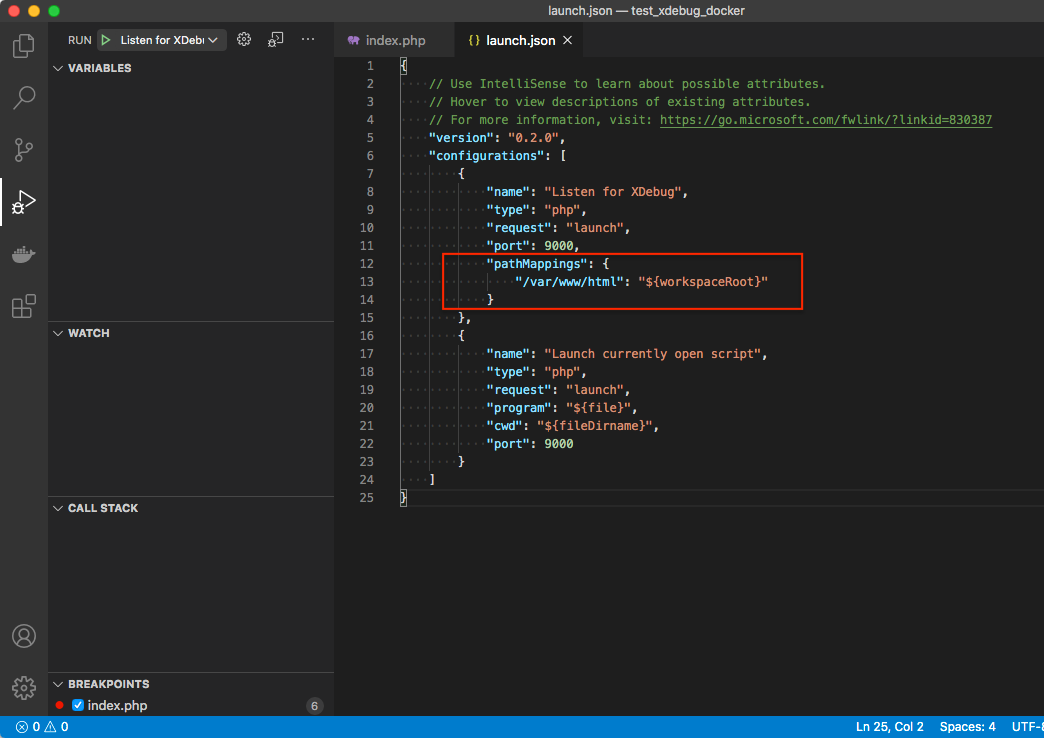
We need to add the following code, which "maps" the folder on the Server (left), with the folder on our Local machine (right)
"pathMappings": {
    "/var/www/html": "${workspaceRoot}"
}
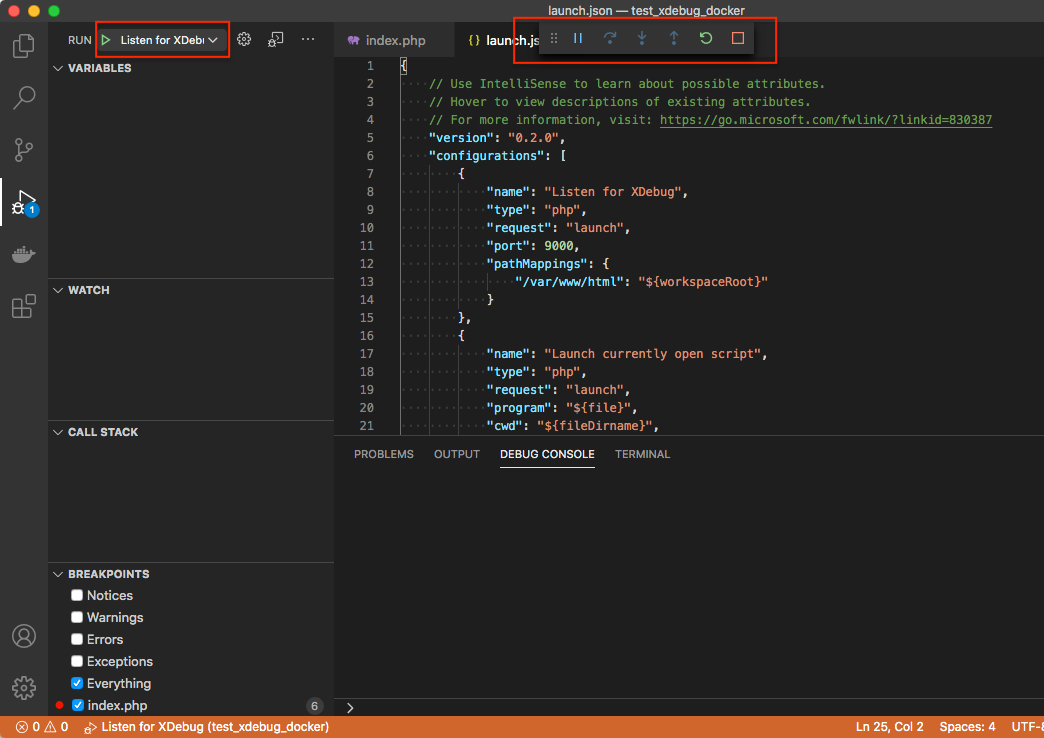
On the top left section, click on the "Play" icon (green triangle)
This will "start" a debugging session on VSCode. You can see that a new toolbar appears at the top center area of the editor.
This toolbar contains the "controls" that allow us to debug our code.
You will notice too that the bottom status bar color has changed to orange.
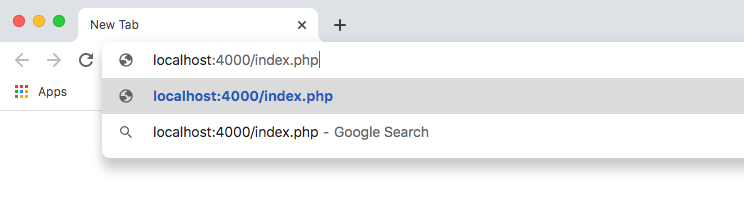
Now, open your preferred Browser, and go to the http://localhost:4000/index.php url.
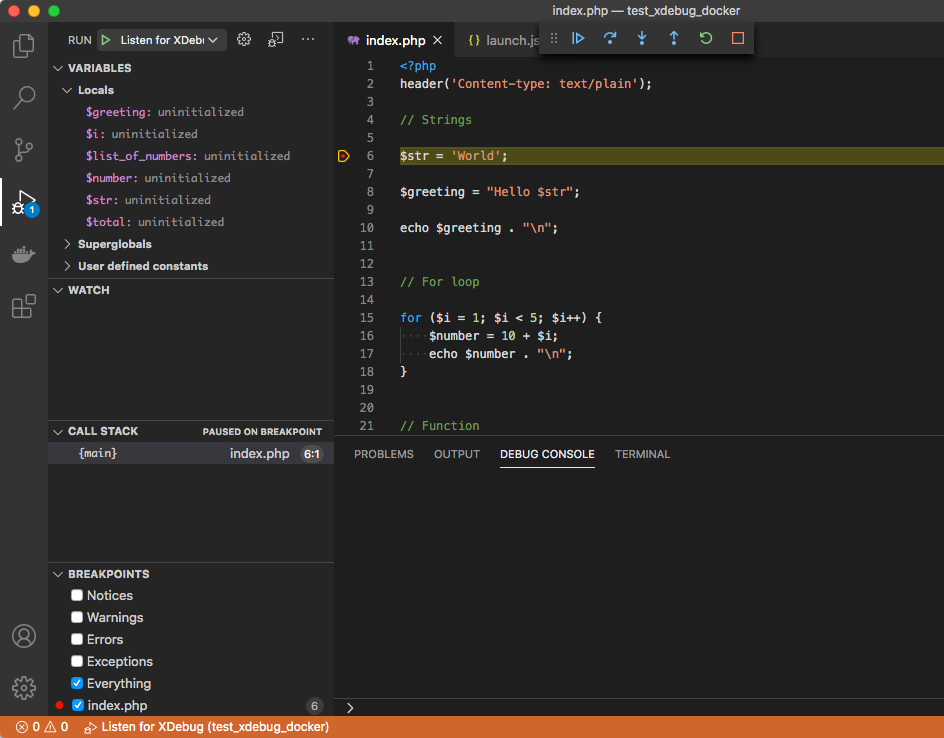
VSCode will regain the focus, and will highlight the line with the breakpoint on the index.php file.
The debugging session will be on "pause". You can start debugging by clicking on the icons on the top toolbar.
Downloads
Related Posts
- Introduction to Docker, and a Practical Example
- How to install Docker on Mac OS X
- Docker Container: Centos 7, Apache, and PHP 7.3
- Docker Container: MySQL 8
- Docker Compose: Centos, Apache, PHP, MySQL
- Set up Xdebug on a Docker Container with Centos 7, and PHP 7.3
- Docker Container: Centos 8, Apache, and PHP, using systemd