Set up XDebug on MAMP and VSCode
To set up XDebug we must edit the php configuration file php.ini.
A particular detail regarding MAMP, however, is that there are two php.ini files for each php version.
So, first we must identify which version of php we are using.
In order to do that, we open the /Applications/MAMP/conf/apache/httpd.conf file and search
for the "LoadModule php" text.
We will find a line similar to this one:
LoadModule php7_module /Applications/MAMP/bin/php/php7.2.10/modules/libphp7.so
By looking at the path specified on that line, we can determine that we are using the version 7.2.10 of php.
Edit php.ini files
Then, the php.ini files are located at the following paths:
/Applications/MAMP/conf/php7.2.10/php.ini
/Applications/MAMP/bin/php/php7.2.10/conf/php.ini
Edit each file and uncomment the following line, by removing the ";" at the beginning of the line.
;zend_extension="/Applications/MAMP/bin/php/php7.2.10/lib/php/extensions/no-debug-non-zts-20170718/xdebug.so"
So that it will look like this:
zend_extension="/Applications/MAMP/bin/php/php7.2.10/lib/php/extensions/no-debug-non-zts-20170718/xdebug.so"
Additionally, locate the [xdebug] section, and add the following instructions to both php.ini files:
xdebug.remote_enable = 1
xdebug.remote_autostart = 1
Note: Restart MAMP server for this changes to take effect.
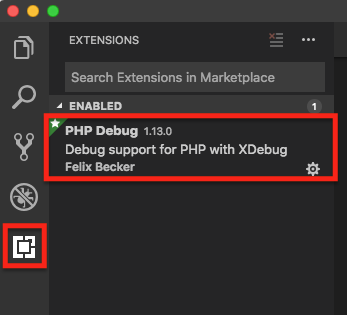
Install PHPDebug extension on VSCode
On VSCode, go to the Extensions tab, and search the PHPDebug extension and proceed to install it.
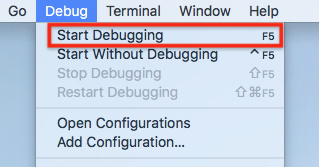
Setup XDebug on VSCode
On VSCode, go to the Debug menu, and click on the "Start Debugging" menu option.
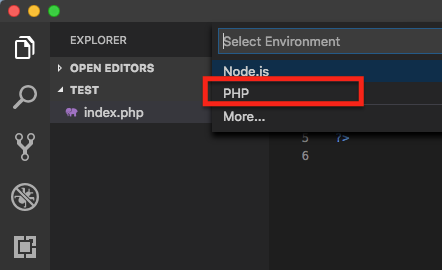
A drop down with the available debuggers will be displayed. Click on the "PHP" option.
The "launch.json" file will be created.
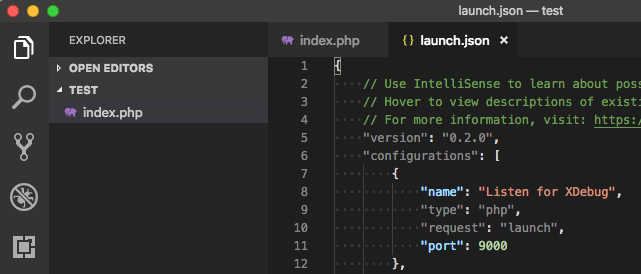
If the "launch.json" file is not created, click on the "Add Configuration..." menu option.
Start debugging
Go to the Debug menu, and click on "Start Debugging."
The editor will switch to the debug mode.
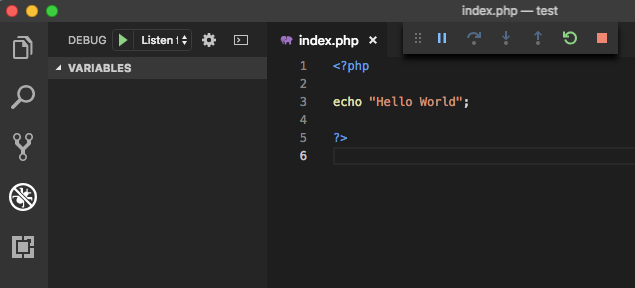
On the status bar, you will notice the editor shows the "Listen for XDebug" state.
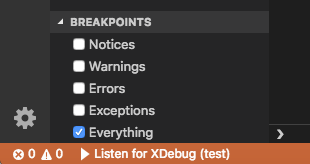
Now you can setup breakpoints on your code.
Open your website.
VSCode/XDebug will detect the execution of the site and will start debugging.
If you go to the Folder Navigation bar, you can click on the "Bug" icon to return to the Debug area.